

The challenge & design objective
Help affiliate users find the signal, understand its context and choose the next useful action.
Turn a dense dashboard into a clear starting point
Affiliate work brings together traffic, conversions, campaign status and commission information. When these compete for attention, users must spend time deciding where to look before they can decide what to do. The design objective is a modern workspace with a strong overview, predictable navigation and visible paths to deeper reports.
- Orient: show the most useful performance signals before detailed tables.
- Investigate: keep time ranges, metric labels and supporting rows close to their visualizations.
- Act: connect campaign status, tickets and reporting shortcuts with the daily workflow.

Research themes & user needs
Use the discovery themes to prioritize a dashboard that is easier to scan, interpret and navigate.
Translate requested capabilities into experience priorities
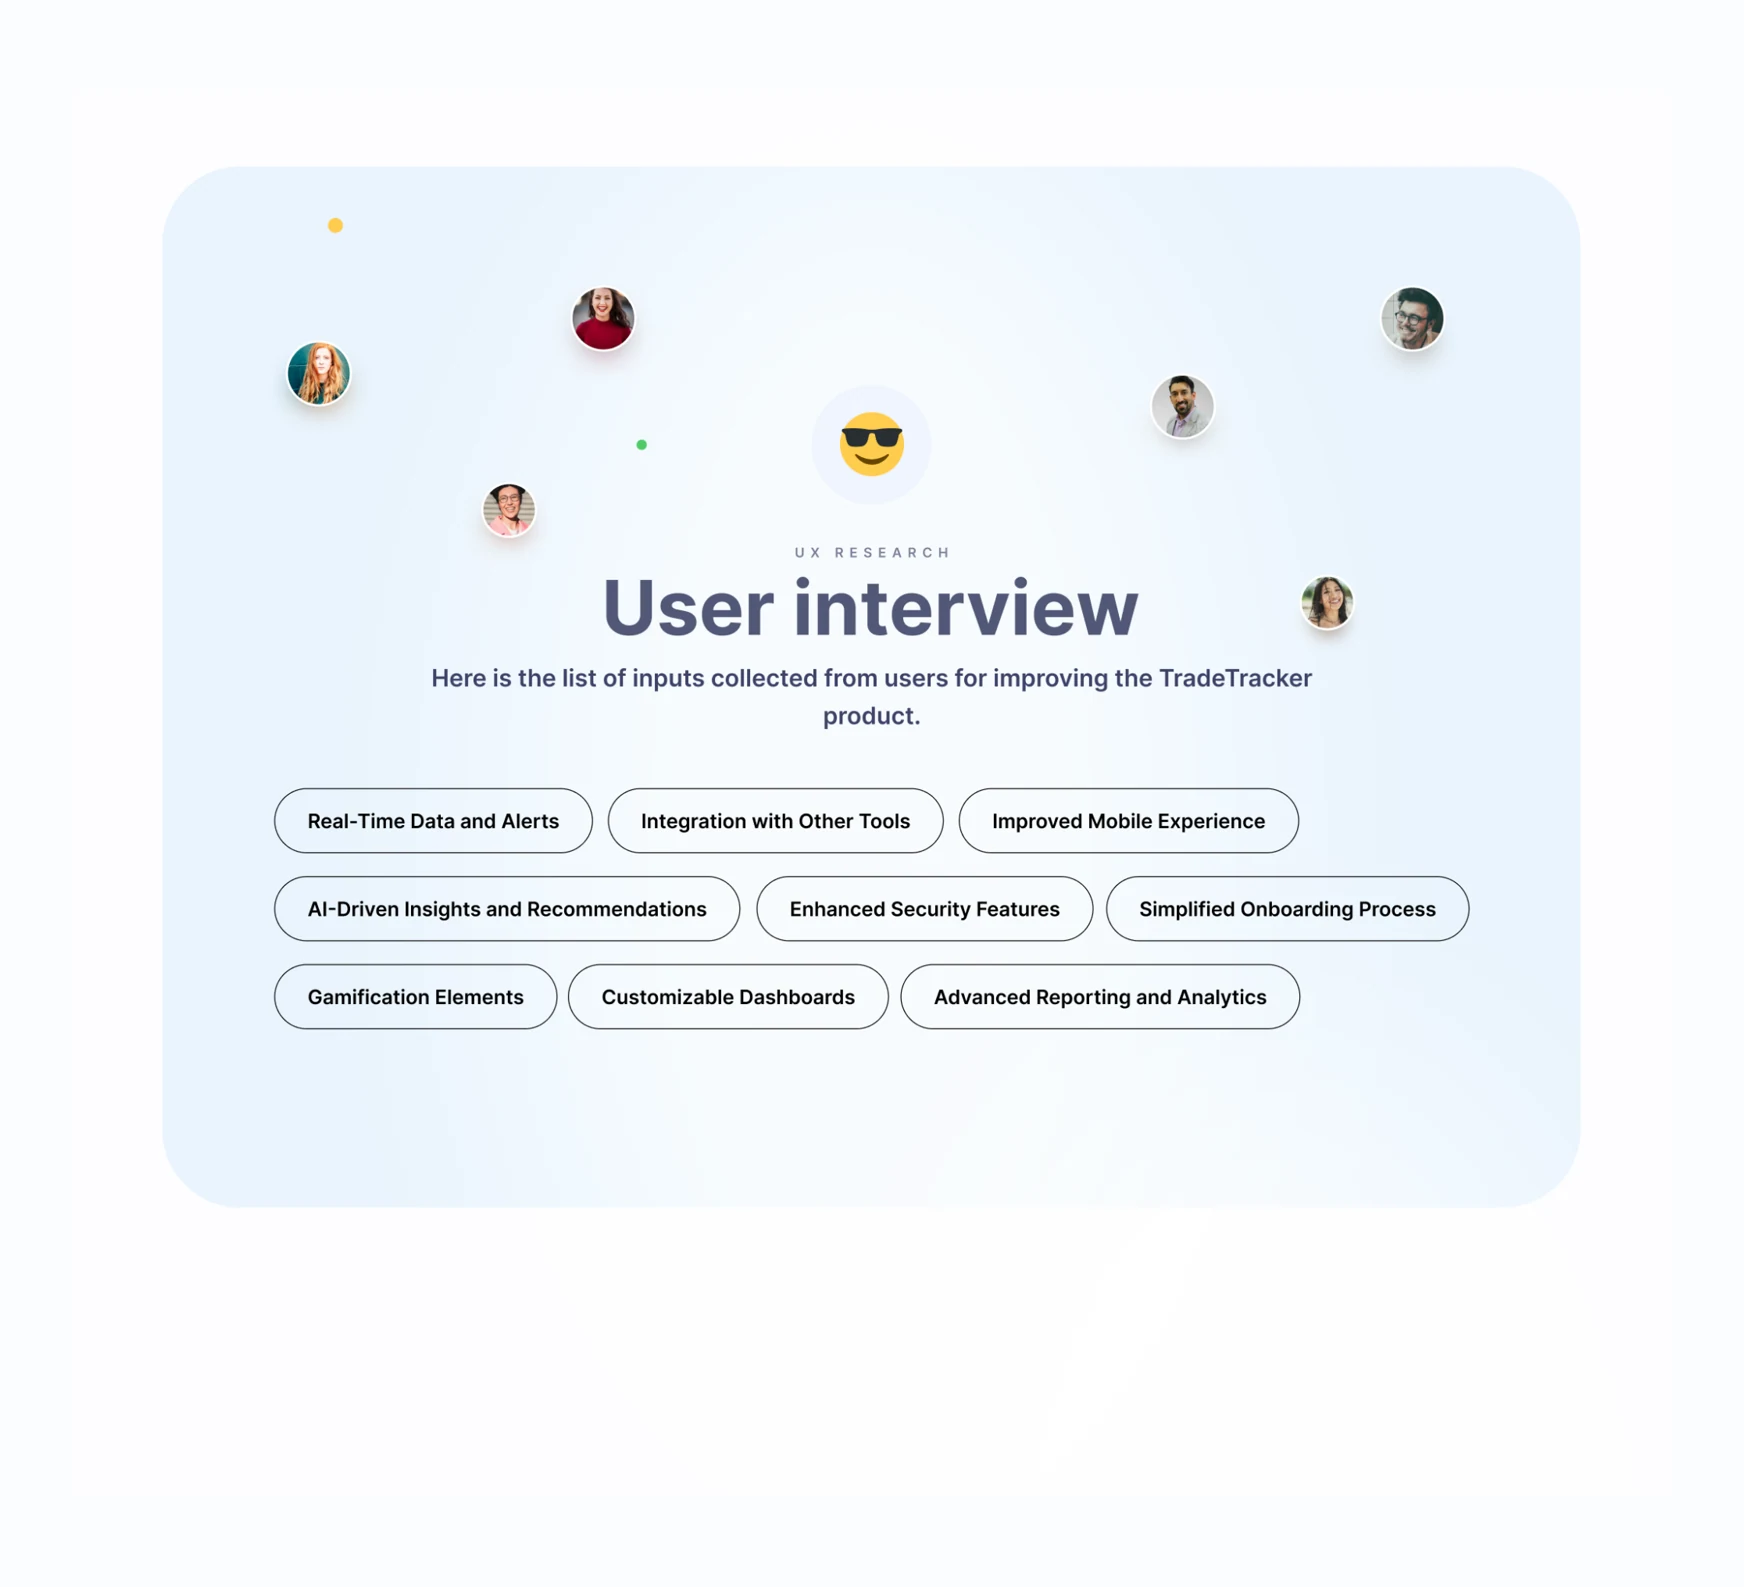
The research material highlights timely data, useful alerts, integration with other tools, a clearer mobile experience, customizable dashboards and stronger reporting. AI recommendations, security improvements and gamification appear as exploration themes; they are not presented here as delivered dashboard capabilities.
- Clarity: distinguish key outcomes from secondary supporting information.
- Control: make report scope and the active time period understandable.
- Confidence: use consistent status treatments and readable details.
- Continuity: consider how the same tasks work across desktop and smaller screens.
Personas, problems & hypotheses
Use user context to frame the questions the interface needs to answer.
Different experience levels, shared questions
The persona concepts represent established affiliate marketers, new affiliates, creators and marketing managers. They suggest different levels of domain knowledge, but share the need to monitor campaigns, understand earnings and locate useful guidance. The personas are design tools for discussing tasks and barriers, rather than proof of a particular audience distribution.

Keep assumptions testable
The brainstorming material proposes that a cleaner interface, relevant dashboard content and clearer reporting could improve the experience. These are hypotheses to evaluate with representative tasks. The case study focuses on the visualized workflows and avoids treating a design assumption as a measured product outcome.

From research to a coherent UI
Move through research, UX structure, branding and interface design with a shared set of decisions.
- Discover: review the current experience, comparable products and interview themes.
- Define: group user goals and map the paths between overview, campaigns, creatives and reports.
- Design: explore structure in wireframes, then establish reusable visual rules.
- Refine: review the prototype, check key states and prepare task-based usability evaluation.

Information architecture & task flows
Organize the workspace around the questions users bring to it, rather than the number of available widgets.
An overview with clear branches
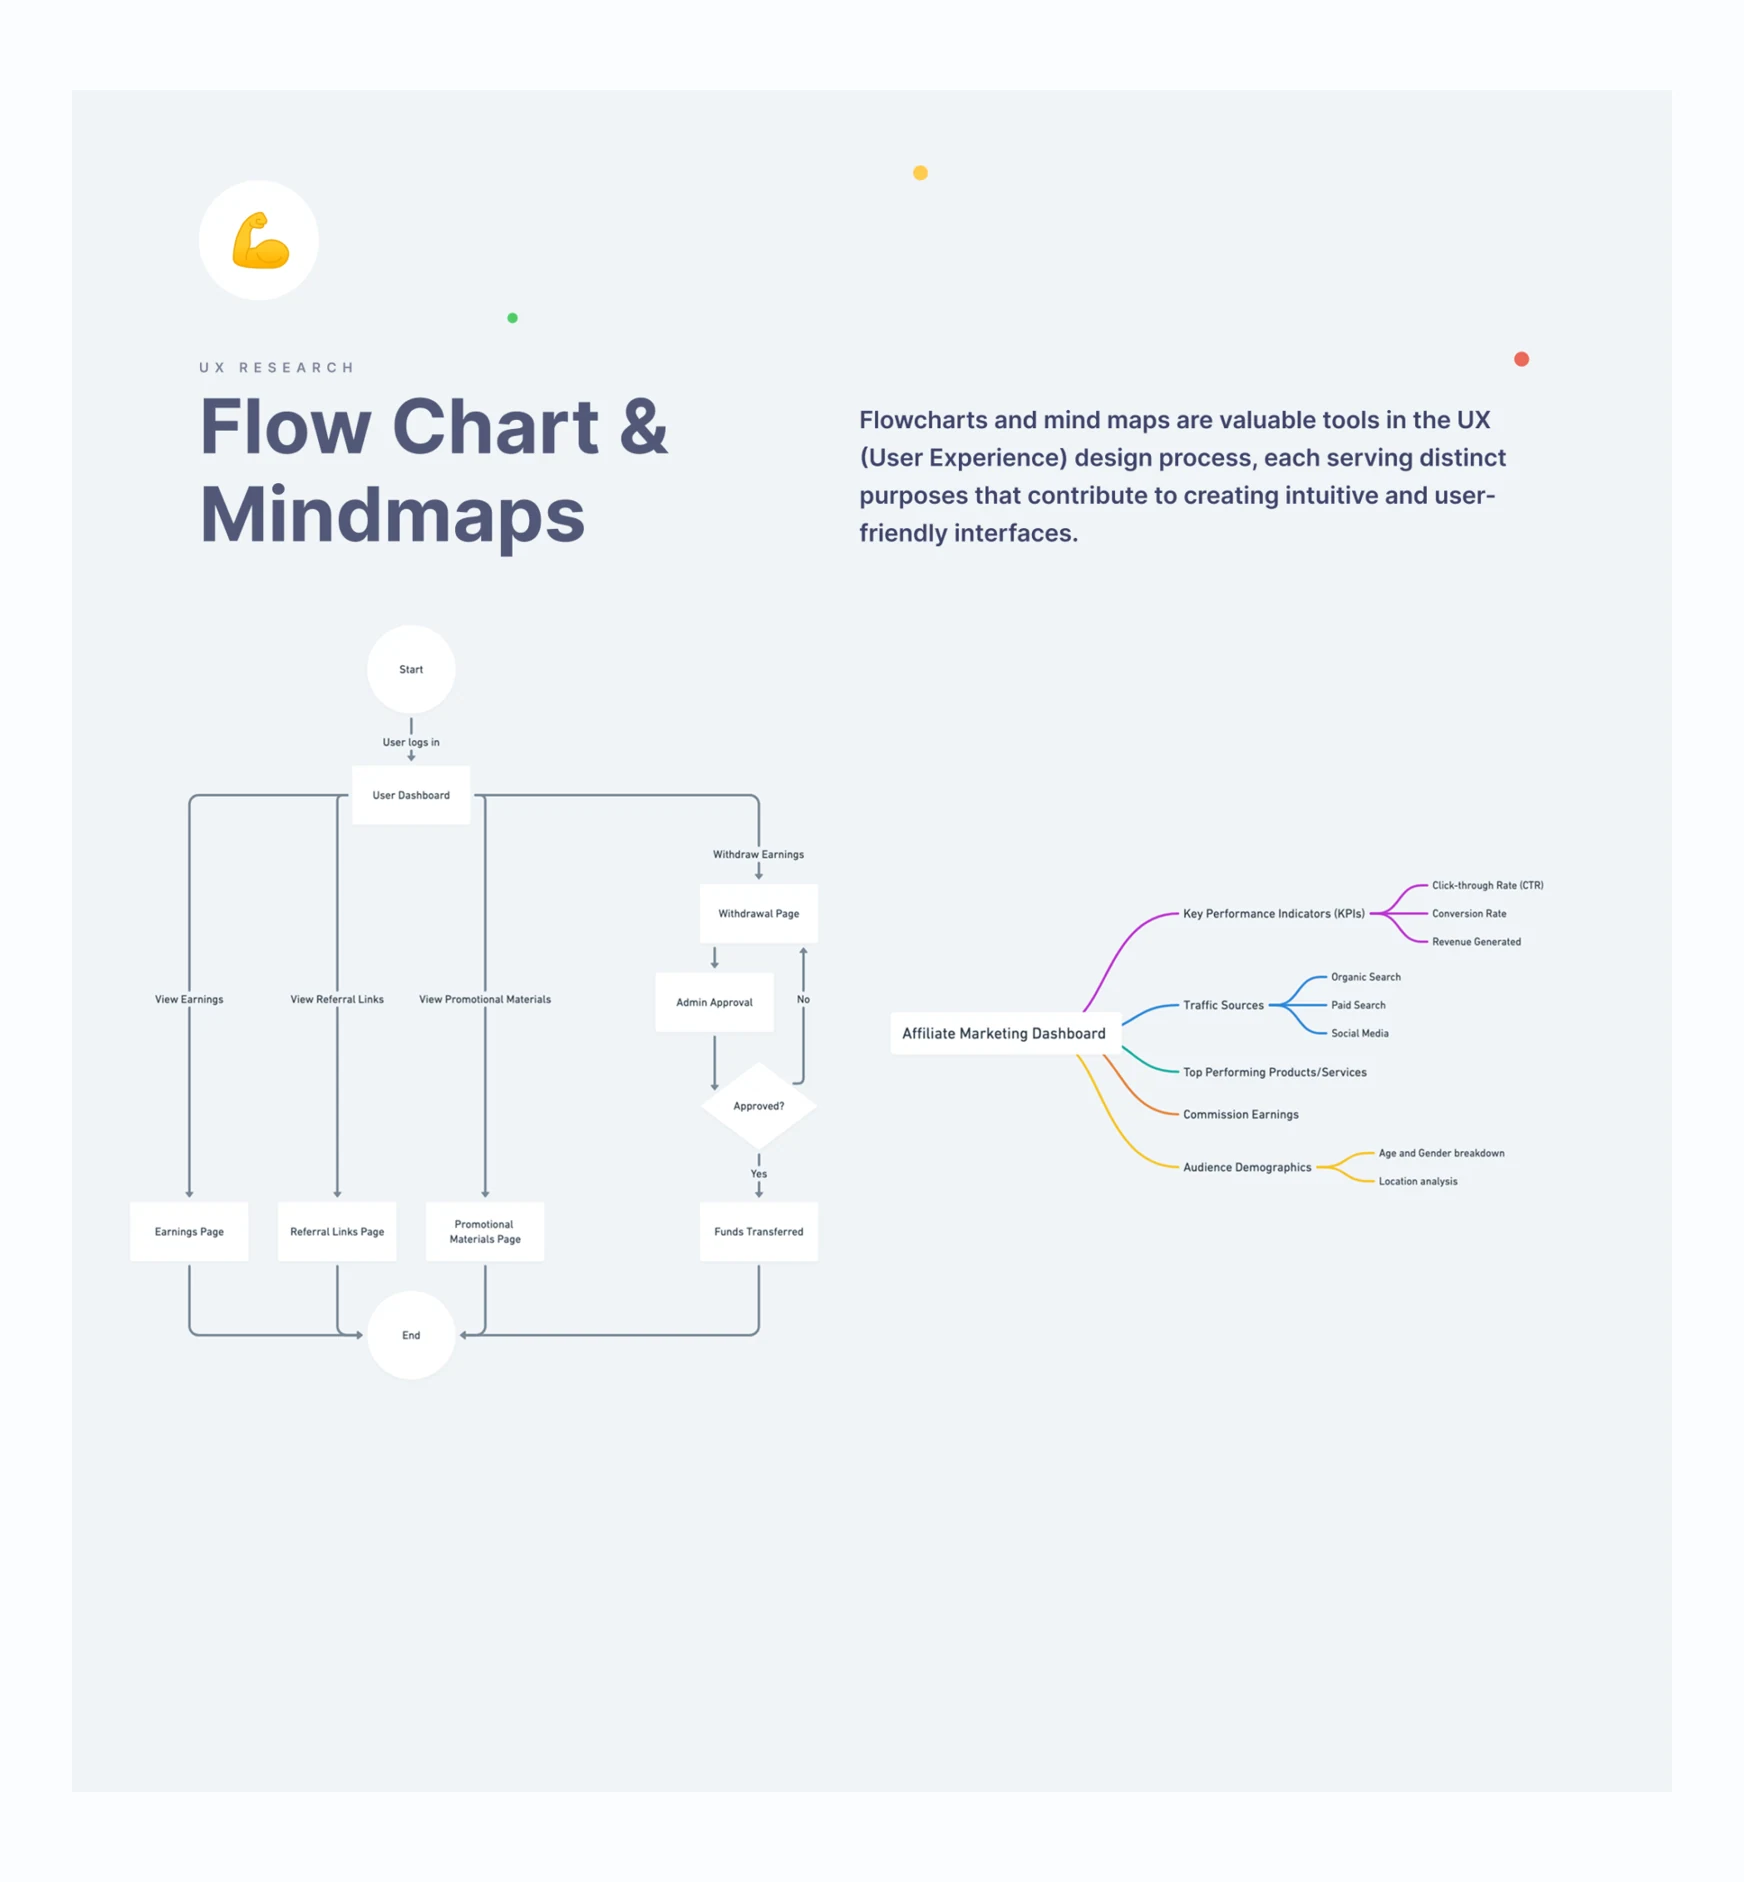
The flow diagram places the dashboard after login, with paths to earnings, referral links, promotional materials and withdrawal requests. The mind map groups performance indicators, traffic sources, products, commissions and audience information. Together, they help separate navigation decisions from the detail shown inside a report.
- Give the main sections stable navigation labels and recognizable entry points.
- Separate a quick performance check from a detailed reporting task.
- Make request states, approval decisions and return paths visible in journeys that need them.
Wireframes & dashboard concept
Build a readable structure before adding the visual language.
Resolve the reporting hierarchy first
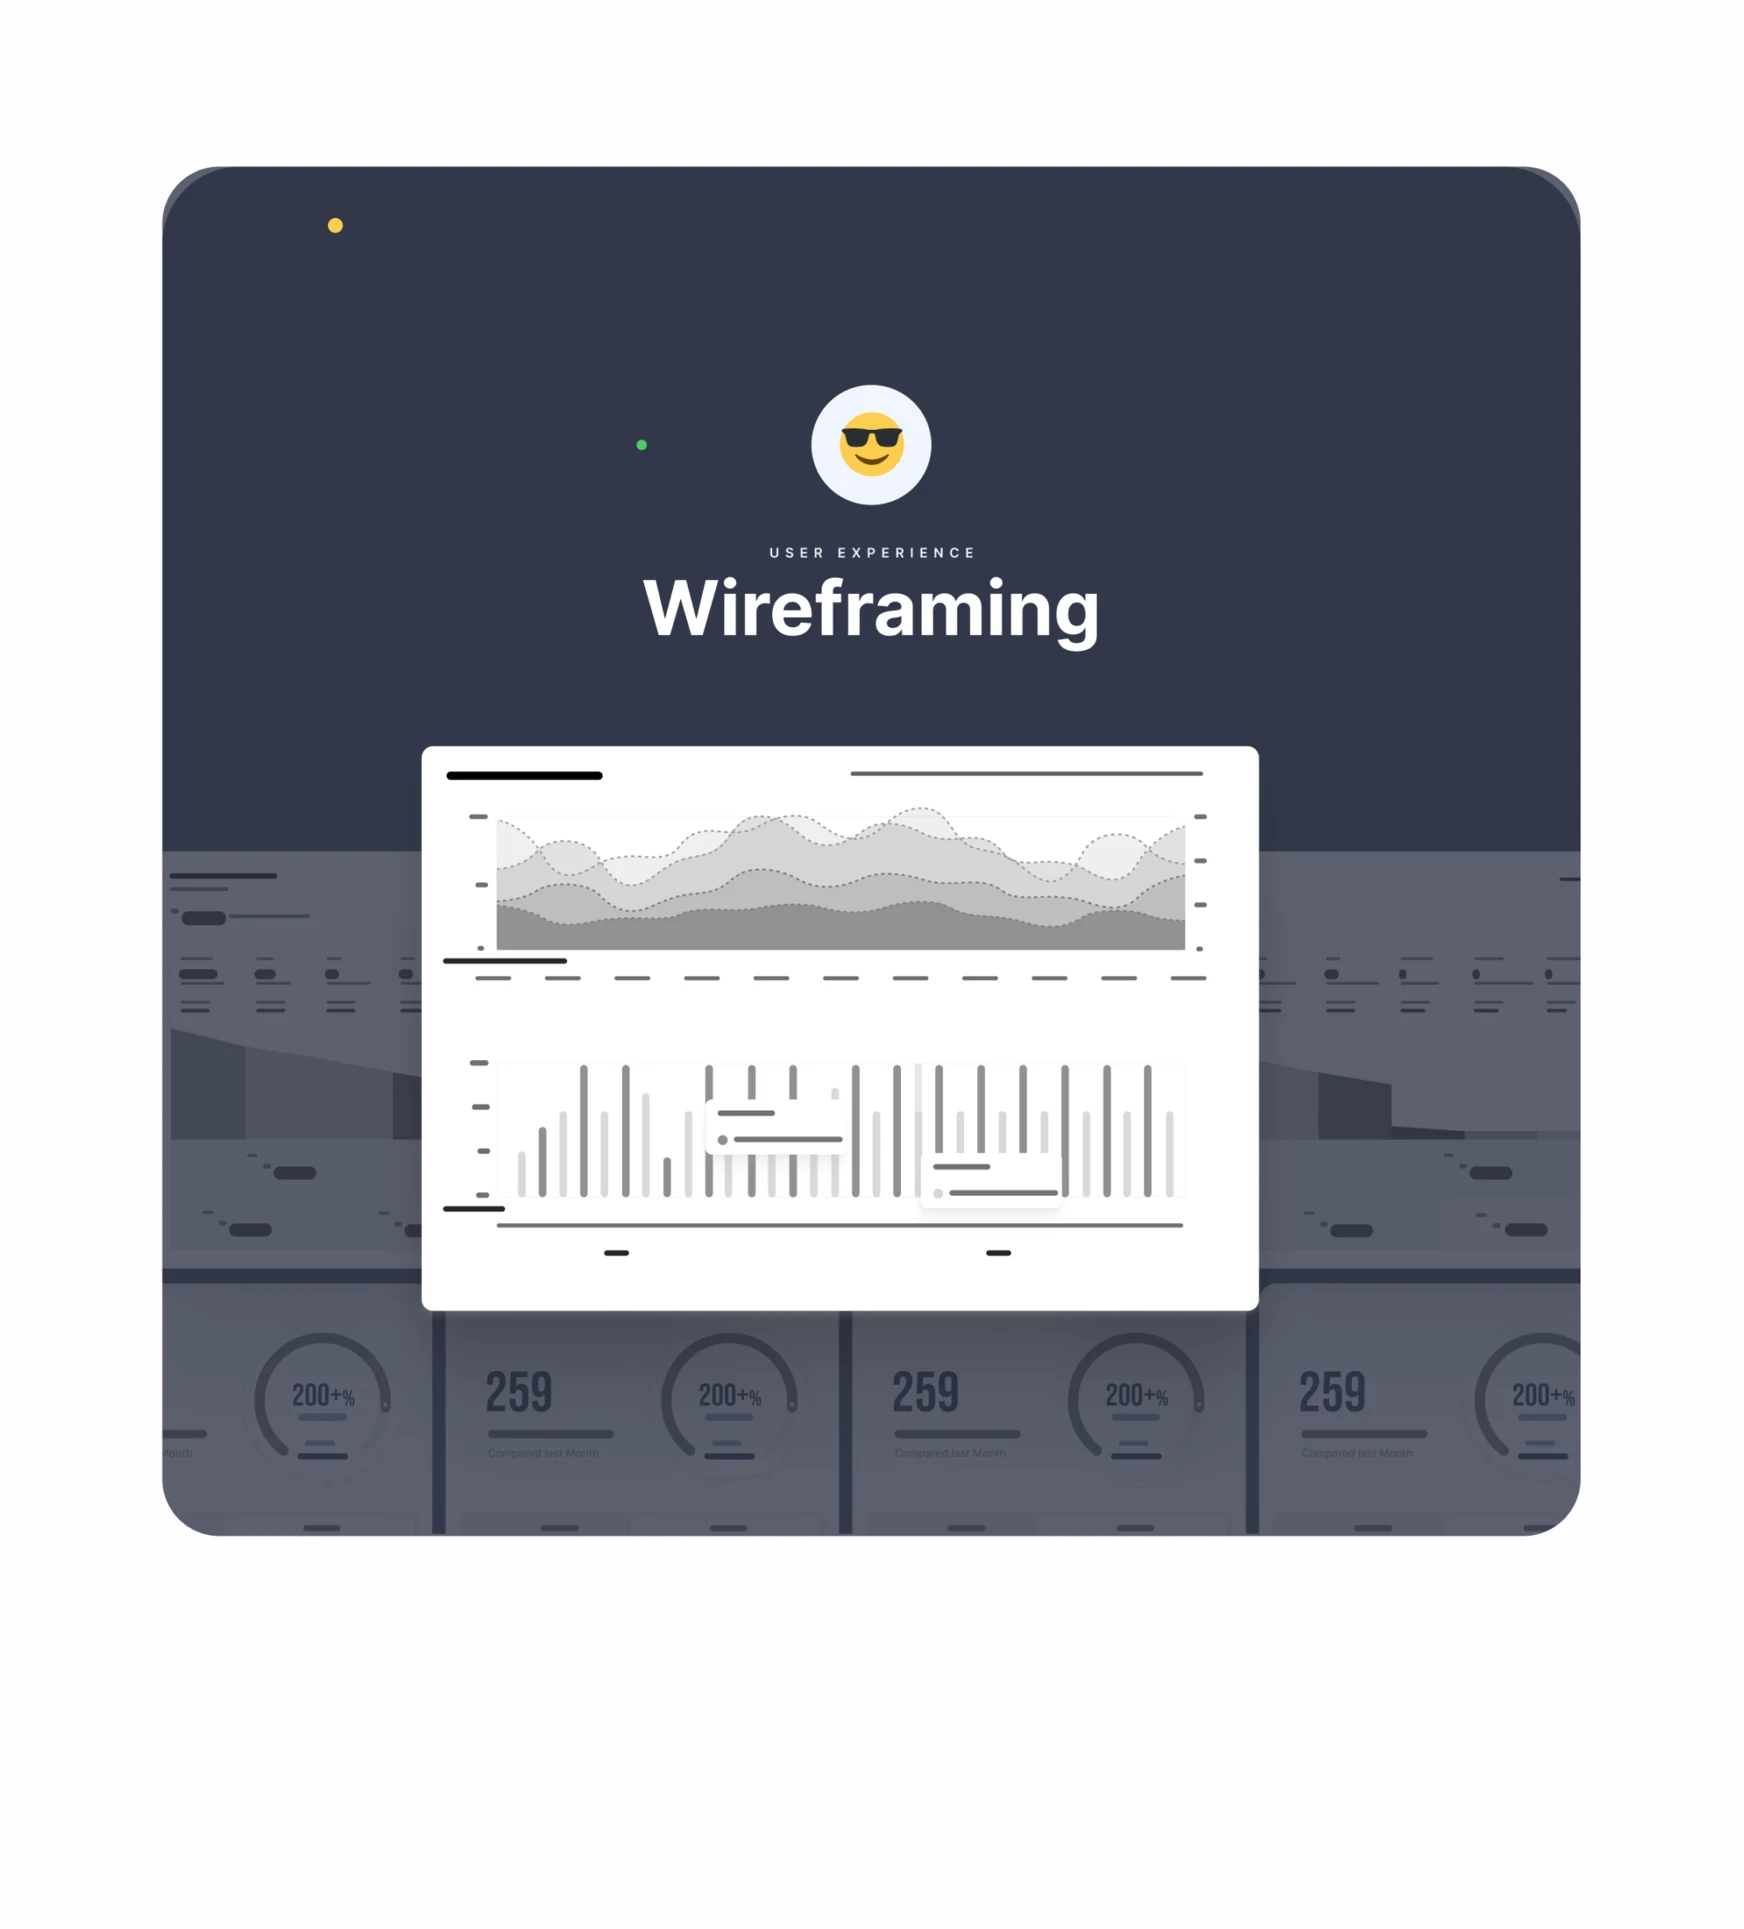
Wireframes establish the relationship between summaries, time-series charts, financial context and supporting tables. This lets the design explore density and grouping before color and decoration are introduced.
Carry the structure into the interface
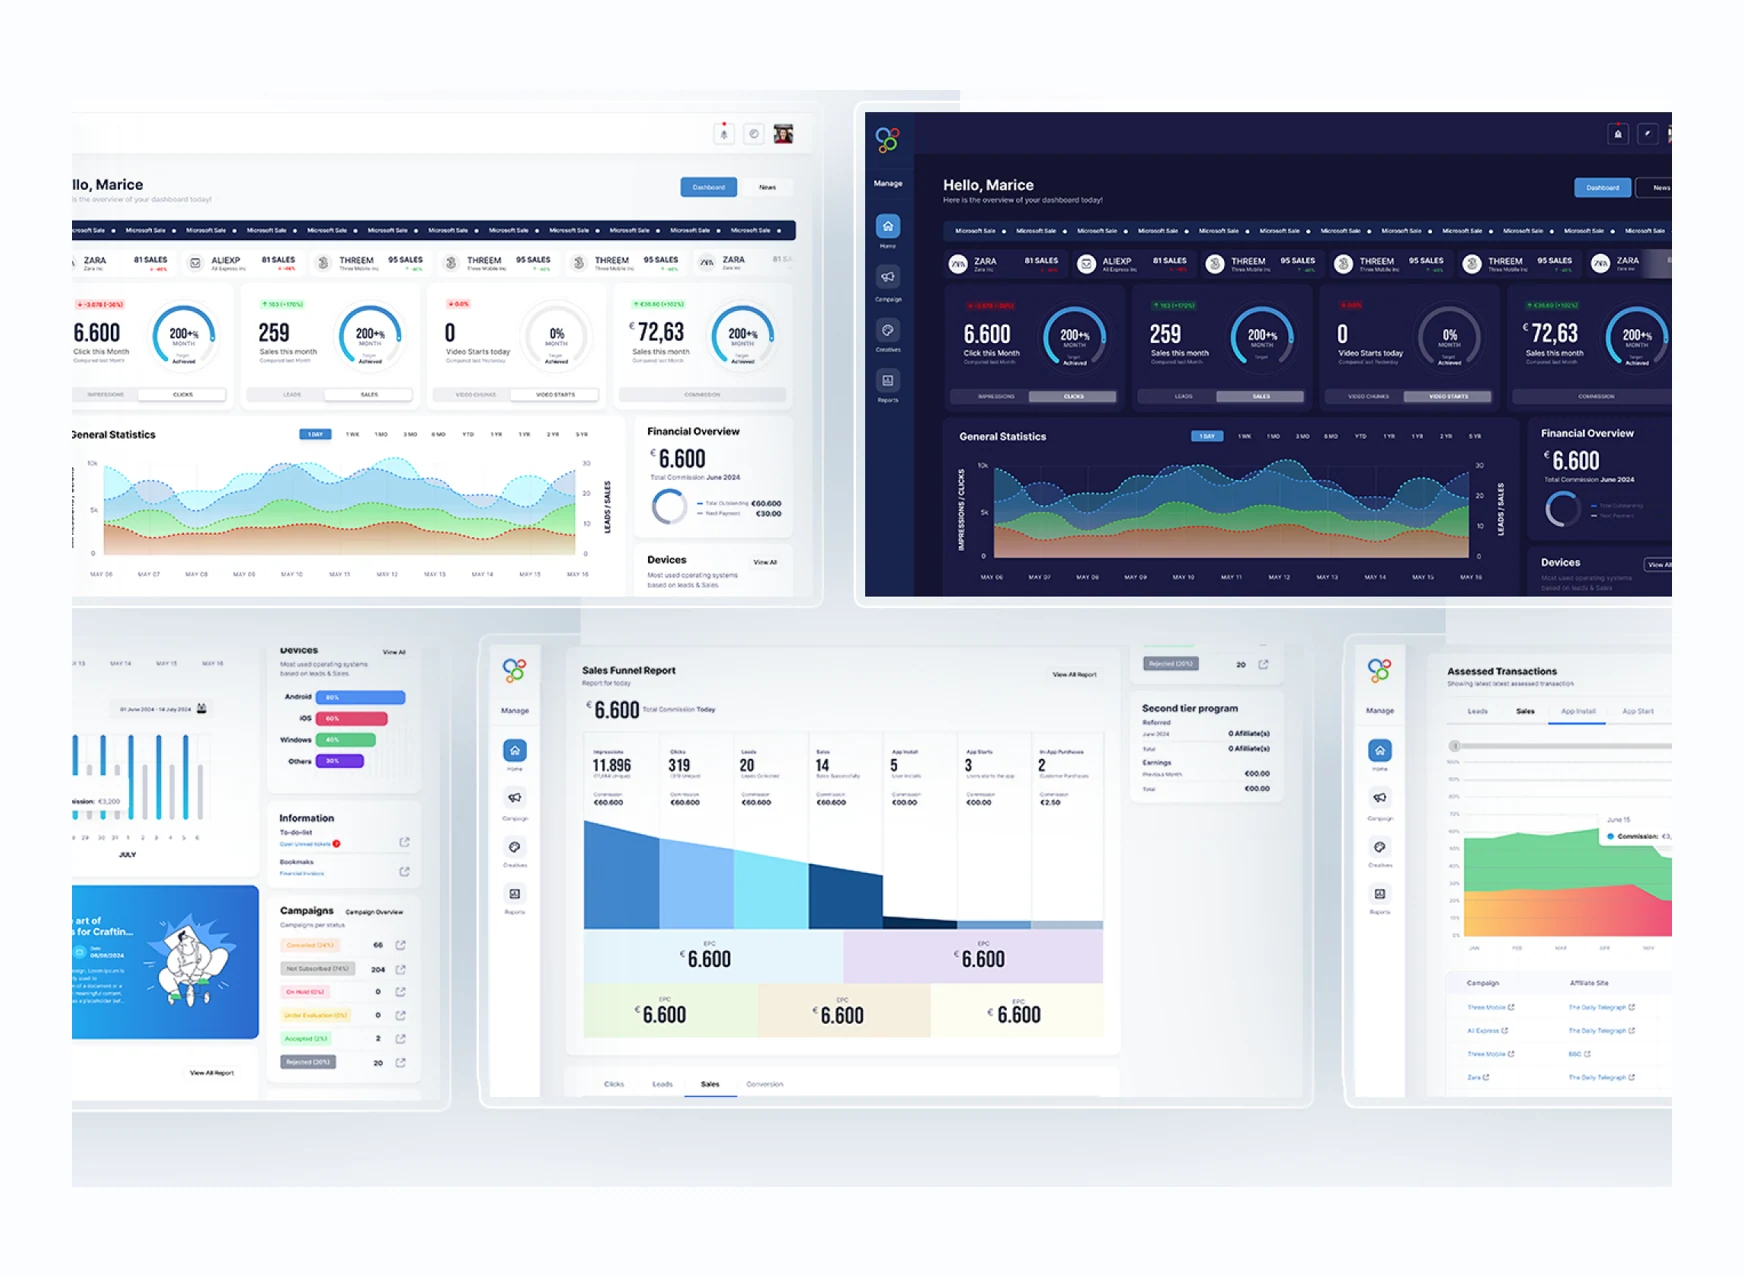
The concept uses a stable side navigation, a row of summary cards and larger analysis modules below. Secondary information sits in a right-hand column, so the main report area can remain the visual anchor.
Overview → trend → context
Help users move from a headline result to the time period and supporting information behind it.
Start with a concise performance read
Summary cards bring clicks, sales, video activity and commission into a common pattern. Each card pairs its primary value with a comparison or target context and a metric selector, making the overview useful without requiring an immediate trip into a detailed report.
Then inspect the pattern over time
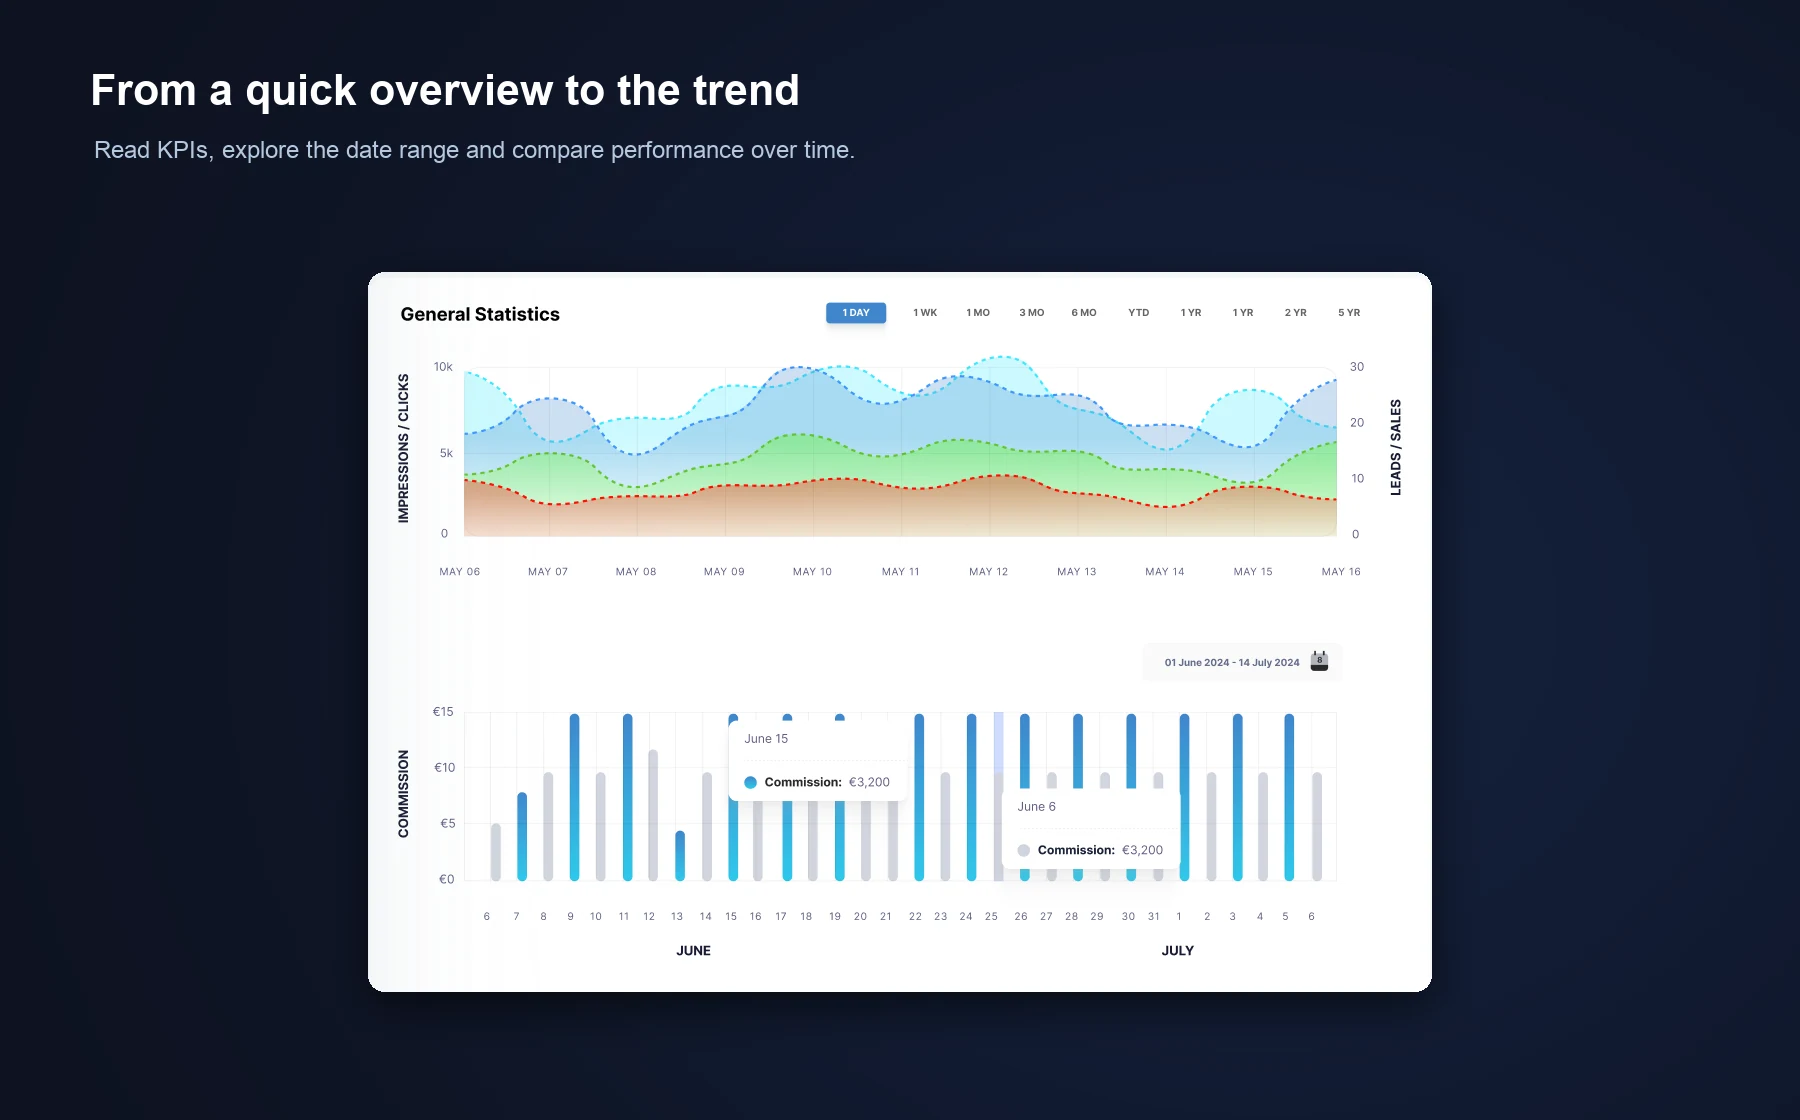
General Statistics combines a multi-series trend with commission bars and visible date controls. The adjacent financial and device summaries add context while preserving a consistent scan path through the main analysis area.
Understand the conversion journey
Present the progression from exposure to action as one structured report.
- Read the headline commission in the report’s context.
- Compare impressions, clicks, leads, sales and app events across the same sequence.
- Use stage totals and the visual funnel together to identify where further investigation is needed.
- Continue into the detailed report when the summary raises a question.

From summary to the underlying records
Let users inspect the evidence behind the dashboard rather than stopping at a total.
Tabbed transaction views connect a selected metric with the rows that support it. Campaign, affiliate site, product, commission and date columns help users move from a chart to a specific record. Ranking tables place comparable results side by side so the reporting context stays visible.
- Keep the active metric apparent when switching tabs.
- Align repeated column labels and value formats to make rows easier to compare.
- Provide a clear path to the complete transaction view.

Keep daily campaign work connected
Bring campaign monitoring and follow-up activity into the same reporting environment.
Campaign status and ticket activity sit within the broader performance workspace. The campaign table supports comparison, while ticket rows use text labels and status treatments to distinguish pending and resolved work. News and learning content provide a secondary route to campaign context.
- Use status text alongside color so meaning is not carried by color alone.
- Keep campaign and ticket entry points close to the information users are reviewing.
- Let secondary content support the work without overwhelming the primary analytics.

Connect the event, time period and record
Use consistent reporting patterns for another layer of transaction analysis.
The assessed-transactions module combines event-category tabs, a time-range control, a stacked trend and a detailed table. Repeating these familiar report elements reduces the effort needed to move between a high-level pattern and individual transaction records.

Typography, color & grid system
Use shared rules to keep varied report modules coherent.
A reusable vocabulary for dense information
The visual system pairs Inter with Bebas Neue and a palette of blue, green, red, orange and dark neutrals. Repeated cards, chart labels, comparison treatments and status elements provide a common language across the dashboard.

A grid that supports different report shapes
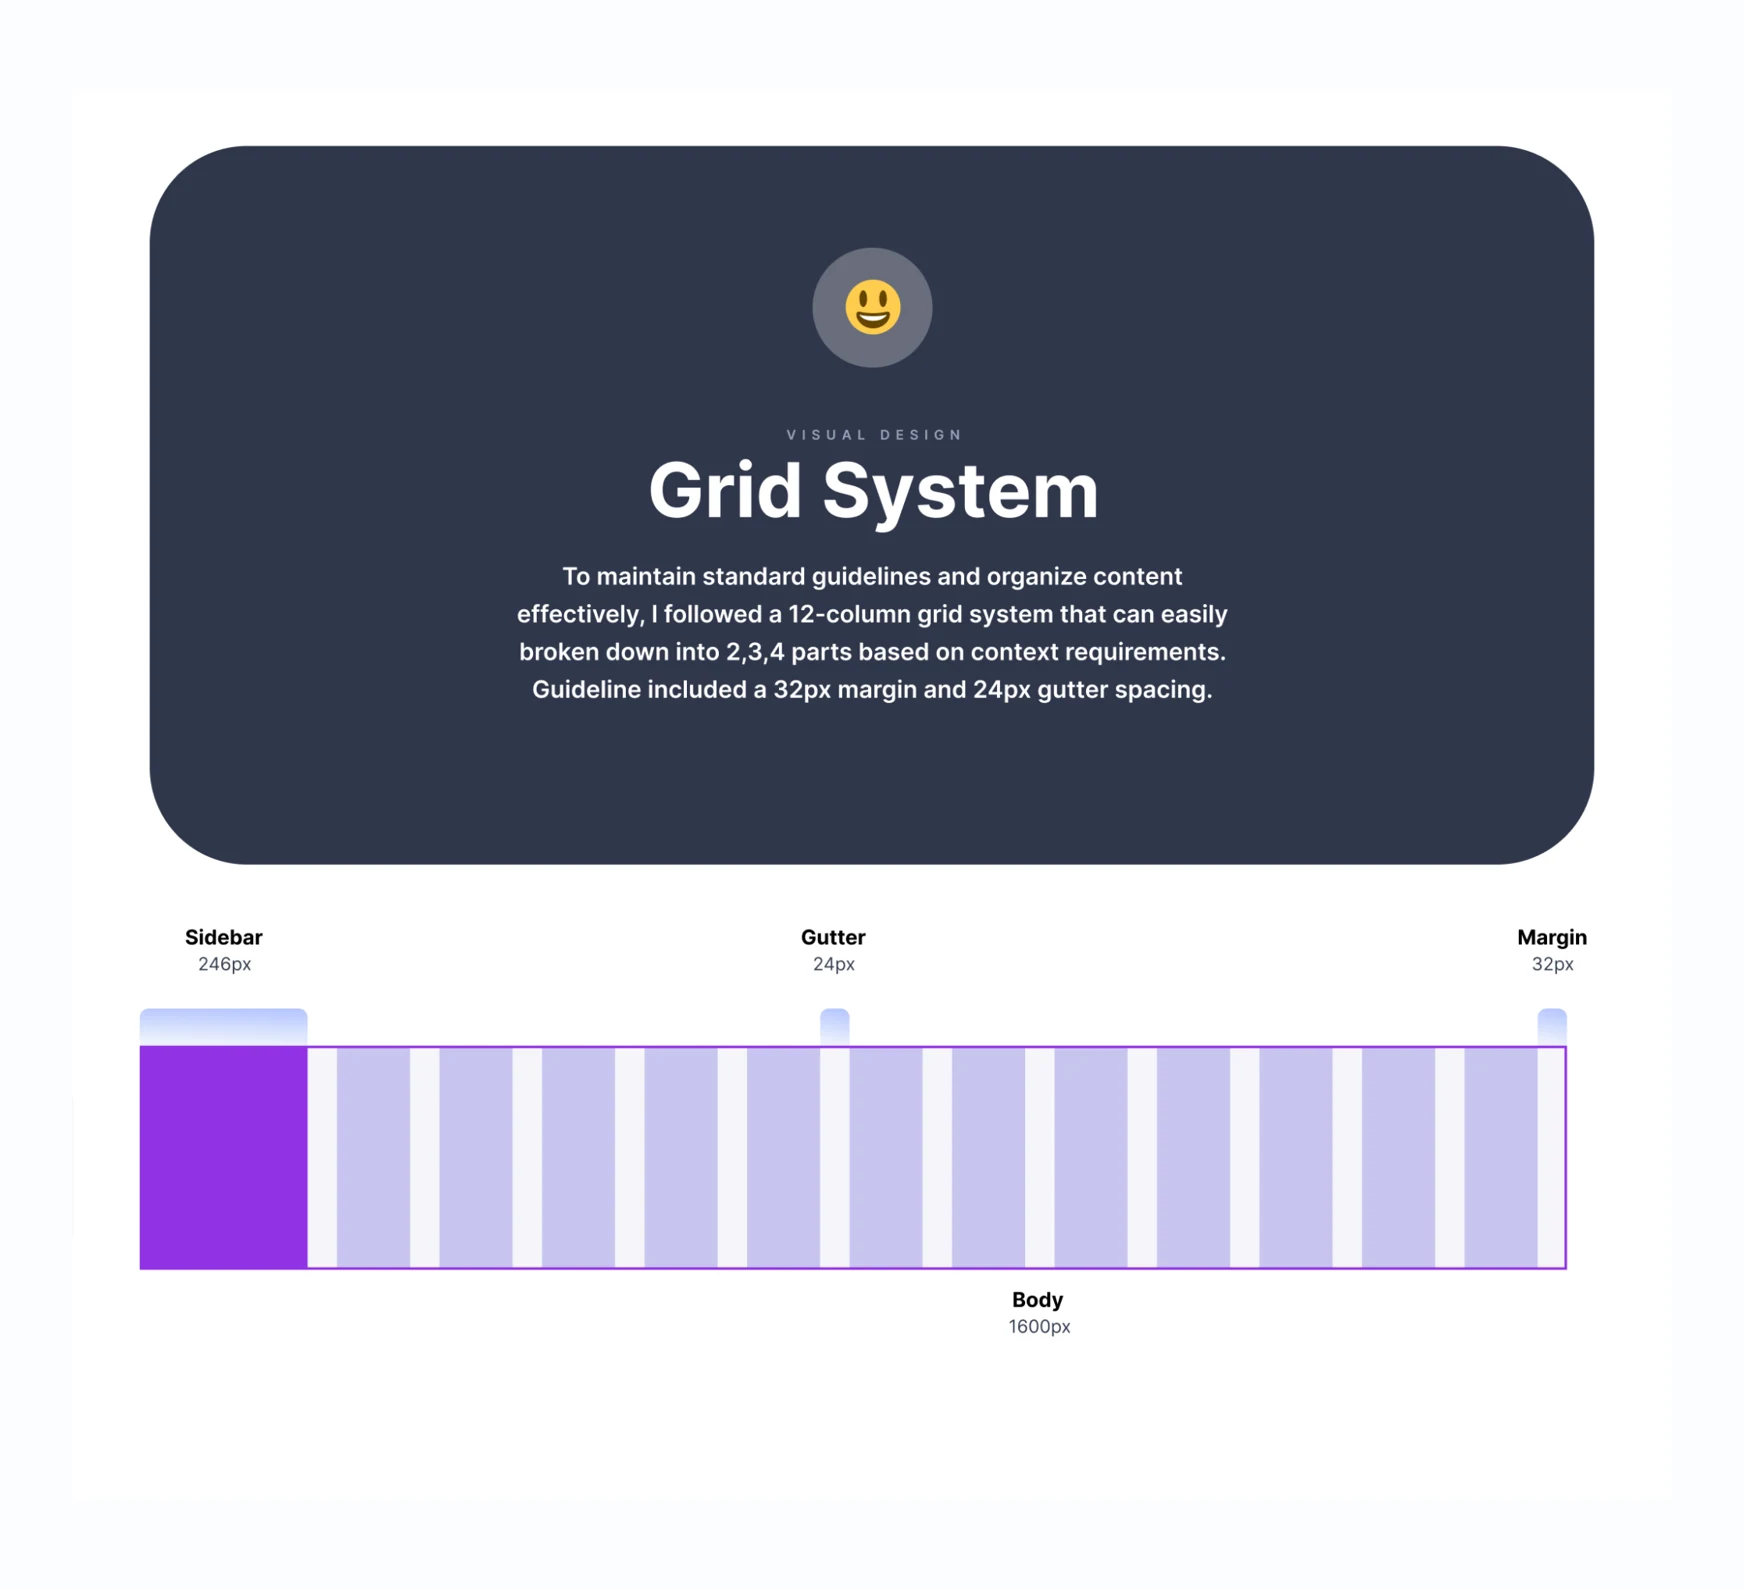
The layout specification uses a twelve-column grid with 32px margins, 24px gutters and a defined sidebar. This allows summaries, charts and tables to use different column spans while staying aligned with the surrounding content.
Two themes, one familiar structure
Preserve orientation and reporting meaning when the visual environment changes.
Light and dark designs retain the same navigation, metric order and module structure. This keeps a theme change from becoming a different interface. Chart series, financial summaries and status information need readable contrast on both surface systems.


Across contexts & the complete view
Support a quick check and a deeper reporting session with the same information structure.
Consider the environment where reporting happens
Laptop and tablet presentations show how the dashboard hierarchy carries into different viewing contexts. The smaller-screen review should prioritize legible charts, usable filters and a practical way to inspect wide tables.


The complete dashboard
The full light and dark layouts bring the overview, funnel, campaign tables, tickets, assessed transactions and campaign news together. The focused workflow images above provide a closer view of individual modules.

